Social Work Meta-Data Project GitHub repository
Demonstration · Verified topical corpus

Artificial Intelligence in Social Work, 1989–2026

Every article on artificial intelligence in the disciplinary social work journals: found by search, verified by reading each abstract, and classified by what the study actually does rather than what it is about.

278JOURNAL ARTICLES
200CONFERENCE PRESENTATIONS
37YEARS COVERED
58JOURNAL OUTLETS

What this demonstrates

This page works through one analysis from start to finish using the project's databases: cast a wide net, read everything, classify by a stated scheme, and publish the labels so that individual decisions can be checked.

Two results run through the page. First, social work has been writing about artificial intelligence for more than thirty-five years: the current surge is the third technological wave, not the first, and what changed over time is the balance of the literature, from describing systems, to building them, to studying how practitioners react to them.

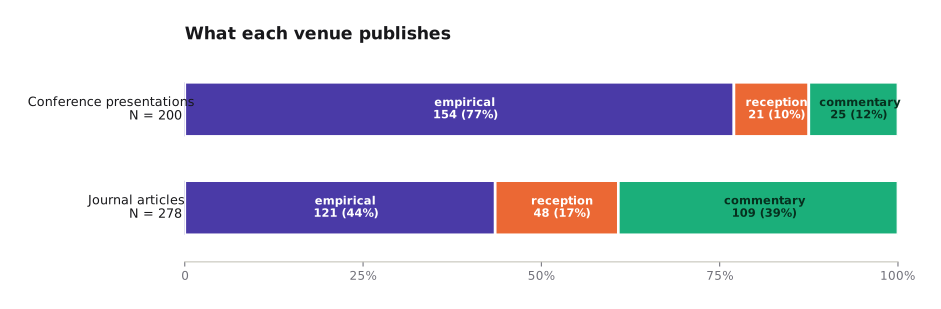
Second, the two venues carry different mixes because they do different jobs. SSWR is an empirical research conference by design, and its composition shows it: 77 percent of verified presentations report hands-on empirical AI work. The disciplinary journals publish commentary, reviews, and curriculum pieces alongside studies, so empirical work is 44 percent there. Much of the conference work reaches print in health, informatics, and interdisciplinary journals outside the social work journal set, so the journal corpus here should be read as what the discipline prints in its own journals, not as the whole of its research activity.

Before ChatGPT: what "AI" meant in 1989

Generative chatbots are the most visible form of AI today, but they are not where this literature begins. Two-thirds of the years in this corpus pre-date ChatGPT, and the earlier work built working systems that made recommendations in child welfare, diagnosis, and treatment planning.

Expert systems and knowledge-based systems

DOMINANT 1989–1998 · 24 ARTICLES IN THIS CORPUS

An expert system encodes a specialist's decision rules, a structured set of if-then statements elicited from experienced practitioners, so that a computer can reach the same conclusion on a new case. This was the mainstream meaning of "AI" in the field's first wave, and social work engaged it directly: First generation expert systems in social welfare (1989), Expert systems: New tools for professional decision-making (1990), Desktop expert systems: Applications for social services (1993).

  • Decision support systems: software that ranks or recommends a placement or service, such as The Continuum of Care System (1990), a working system for human services placement decisions.
  • Knowledge acquisition: the research problem of getting expertise out of a practitioner's head and into machine-usable rules, e.g. Understanding and representing human-services knowledge (1994).
  • Computer-assisted diagnosis, including DTREE, the electronic DSM-III-R (1993) and a knowledge-based system for differential diagnosis of chemical dependency (1992).

Statistical learning and neural networks

DOMINANT 1999–2022 · 62 ARTICLES IN THIS CORPUS

The second wave replaced hand-written rules with patterns learned from data. Social work researchers used neural networks and, later, machine learning to predict outcomes, usually benchmarking them against the statistics the field already trusted: Predicting placement in foster care: A comparison of logistic regression and neural network models (2001), Predicting child physical abuse recurrence: comparison of a neural network to logistic regression (2003), Using artificial intelligence to model juvenile recidivism patterns (1994).

  • Predictive risk modeling in child welfare, which later became the subject of sustained ethical critique.
  • Text and language processing: detecting interpersonal patterns in case text before the phrase "natural language processing" was common in the field.
  • Adoption research begins here too: Child welfare workers' adoption of decision support technology (2009).

Generative AI and large language models

DOMINANT 2023–2026 · 192 ARTICLES IN THIS CORPUS

The third wave is the one most readers recognize: ChatGPT and its successors, applied to documentation, assessment, supervision, and education, and studied for how students and practitioners respond to them. It accounts for roughly seven of every ten articles in this corpus, a surge that arrives on top of a literature already three decades old.

The boundary years are conveniences that smooth a continuous transition. Expert-system work continues after 1998, and neural networks did not stop in 2022; each era is named for the technology that dominated it.

Growth, in two venues

Journal articles across the full 1989–2026 window, then both venues compared over the years they share.

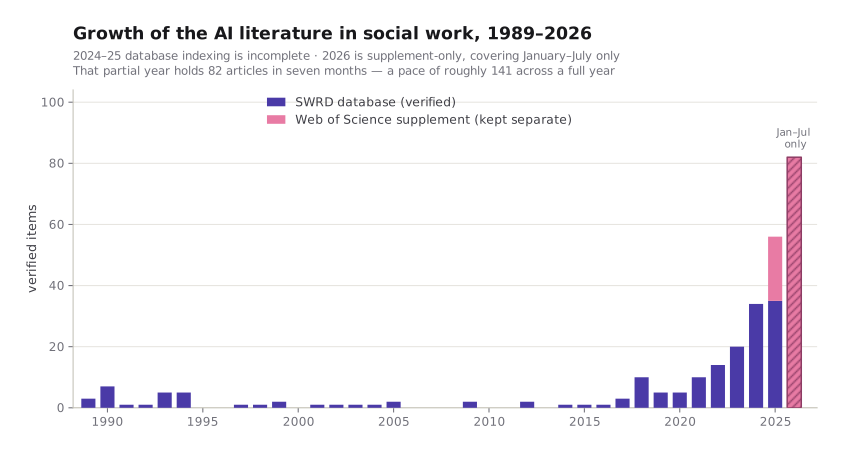
Stacked bar chart of verified AI articles per year from 1989 to 2026. A cluster of about 3 to 7 articles per year from 1989 to 1994, near-zero through the 2000s and early 2010s, then rapid growth from 2018 reaching 34 in 2024 and 35 database plus 21 supplement articles in 2025. The 2026 bar of 82 supplement-only records is hatched and labeled January to July only.
Verified articles per publication year. The darker bars are the SWRD database corpus; the lighter bars are the Web of Science supplement, which is stored and reported separately rather than merged. Two caveats apply at the right-hand end. The 2024–25 database counts are lower bounds because publisher indexing lags. The hatched 2026 bar is supplement-only and covers January to July; its 82 articles in seven months work out to roughly 141 across a full year, an arithmetic annualisation rather than a forecast, and because indexing itself lags, even the seven-month figure is a lower bound.

The series has three phases. An early cluster of 22 articles appeared between 1989 and 1994, when expert systems were an active methodological project in human services. From 1995 through 2016 the topic nearly disappears from the disciplinary journals, averaging under one article a year even as neural-network methods advanced elsewhere. Growth resumes around 2018 and accelerates after the public release of ChatGPT in late 2022; 2023–2026 account for 192 of the 278 articles, and 2026 is only seven months of data.

The trough does not mean the field stopped thinking about computation; it means the disciplinary journals were not where that thinking was published. Read alongside the early cluster, the pattern suggests engagement with AI that is episodic and technology-triggered rather than cumulative.

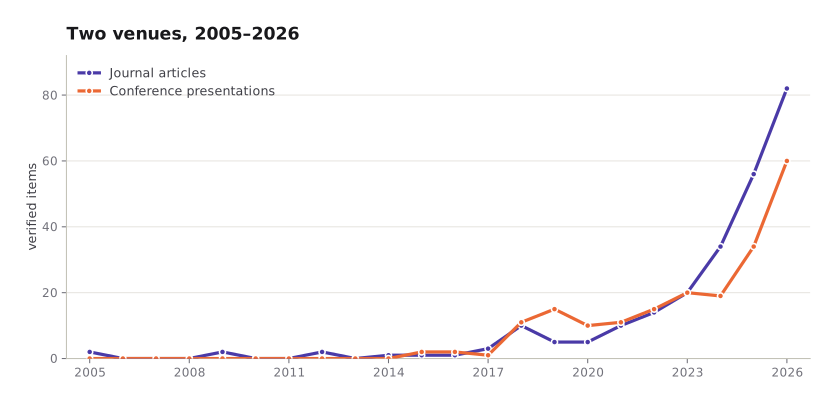
Line chart comparing verified items per year in the two venues from 2005 to 2026. Conference presentations rise from near zero in 2015 to 60 in 2026; journal articles rise later but more steeply, reaching 82 in 2026.
Verified items per year in each venue. Conference activity begins earlier and climbs steadily; the journal literature arrives later and then accelerates past it. The two 2026 points are not equivalent: the conference year is complete, because that meeting has already occurred, while the journal year covers only January to July and will grow.

The conference leads in time. Presentations on AI appear consistently from 2018 onward, several years before the journal literature turns upward, as expected for a venue with a one-year cycle rather than a multi-year review and publication lag.

What the literature does: the classification and its results

The classification asks what a study does, not what it is about. Keyword topic alone cannot separate a team that built and tested a model from a team that surveyed practitioners' opinions about models, yet those are different kinds of knowledge. Every abstract was read and assigned to exactly one of three categories.

Empirical work

The study builds, applies, or tests a system on data. Running a model and measuring what it produces counts, including benchmarking an off-the-shelf tool such as ChatGPT against a task. Traditional statistics used alone do not count (a logistic regression is not artificial intelligence), though such models frequently appear as comparison baselines.

Example: comparing a neural network with logistic regression to predict foster care placement; evaluating whether an LLM can answer licensing exam items.

Reception studies

The study collects original data about people, such as attitudes, adoption, perceptions, readiness, and concerns, without running a system itself. The object of study is the human response to the technology rather than the technology's performance.

Example: surveying practitioners on their willingness to use AI-based decision support; interviewing students about their use of generative AI.

Commentary and review

Conceptual, ethical, educational, critical, or review writing that presents no original data. This is the field's argumentative literature: what AI would mean for practice, what it threatens, how curricula should respond.

Example: an ethics analysis of algorithmic decision-making in child protection; a scoping review of digital practice.

The hard boundary in practice is between the first two. A study in which researchers prompt ChatGPT with case vignettes and then judge the answers is doing something to a system and measuring the result, so it is coded empirical even when the framing is evaluative. Eight articles produced genuinely split judgments and were decided by hand; they are marked in the released data.

The results, by technological era

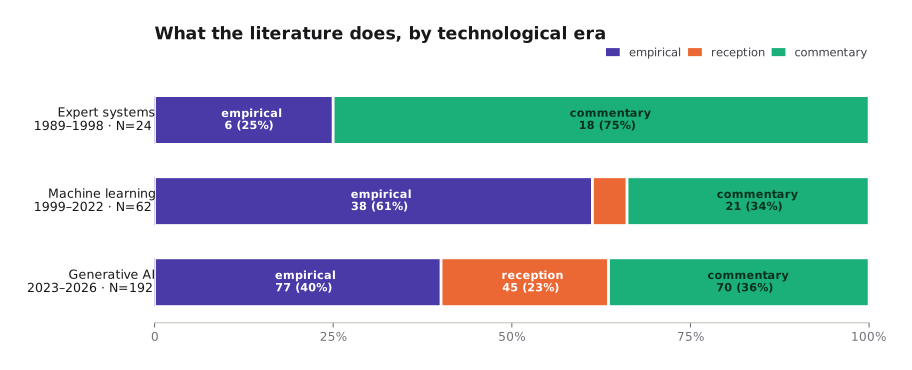
Applying the three definitions across the corpus shows the composition shifting with each wave. Across all years, the 278 articles divide into 121 empirical (44%), 48 reception (17%), and 109 commentary (39%).

Three horizontal 100 percent stacked bars with a legend. Expert systems era 1989 to 1998, N equals 24: 25 percent empirical, 75 percent commentary. Machine learning era 1999 to 2022, N equals 62: 61 percent empirical, 5 percent reception, 34 percent commentary. Generative AI era 2023 to 2026, N equals 192: 40 percent empirical, 23 percent reception, 36 percent commentary.
Within-era composition; segments carry each category's count and share, and segments too small for an in-bar label are identified by the legend. Percentages are shares of each era's articles. The expert-systems era rests on only 24 articles, so its split can move several points on a handful of recoding decisions.

In the first wave, three-quarters of the literature argued about what expert systems could or should do, against a minority that built them. The second wave inverted that: 61% empirical, as researchers with neural networks and administrative data tested predictions against the field's existing statistical baselines. In the third wave empirical work falls to 40%, commentary rises again, and reception studies, which produced 3 articles in the previous twenty-four years, produce 45 in four.

The growth of reception studies has a plausible explanation: generative AI is the first wave of this technology that practitioners and students encounter directly, so for the first time the field is studying its own members' responses at scale.

Where this work appears

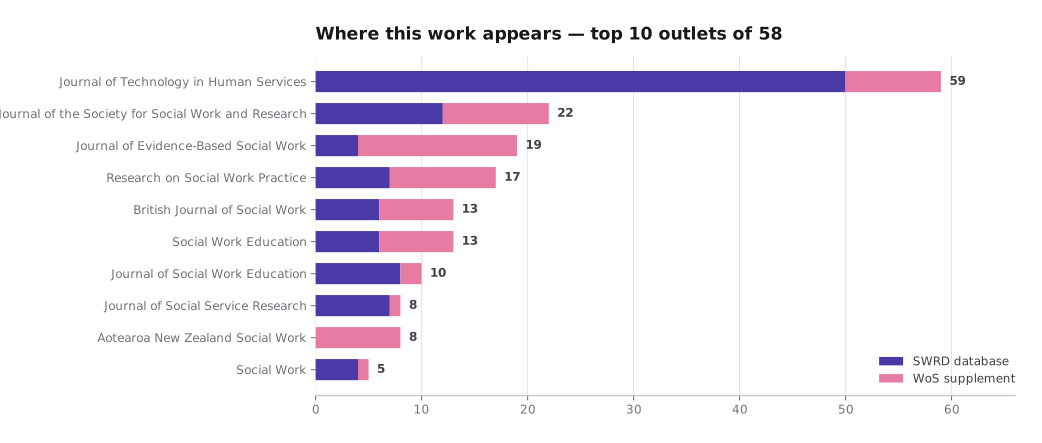
278 articles spread across 58 journals, with a long tail: 23 outlets carry exactly one article.

Horizontal bar chart of the top ten journals. Journal of Technology in Human Services leads with 59 articles, then Journal of the Society for Social Work and Research 22, Journal of Evidence-Based Social Work 19, Research on Social Work Practice 17, British Journal of Social Work 13, Social Work Education 13, Journal of Social Work Education 10, Journal of Social Service Research 8, Aotearoa New Zealand Social Work 8, Social Work 5.
Top 10 outlets by verified article count; the end-of-bar number is the outlet's total, and the two colours split it between the SWRD database and the Web of Science supplement. The top ten carry 174 of 278 articles (63%); the remaining 44 outlets carry 104.

The Journal of Technology in Human Services carries 59 articles, more than the next two outlets combined, and has published this work in all three eras, from expert systems in 1990 to generative AI in 2025. Beyond it the literature is spread widely: generalist journals (British Journal of Social Work, Social Work), research outlets (JSSWR, Research on Social Work Practice), and, in the newest cohort, education journals.

The venue contrast: doing versus publishing

The same search, screening, and three-category scheme were applied to the Society for Social Work and Research conference database, every presentation from 2005 to 2026. Comparing the two verified corpora is where the page's second result comes from.

Two 100 percent stacked bars. Conference presentations, N equals 200: 77 percent empirical, 10 percent reception, 12 percent commentary. Journal articles, N equals 278: 44 percent empirical, 17 percent reception, 39 percent commentary.
Within-venue composition of the verified corpora; segments carry each category's count and share. Conference N = 200; journal N = 278.

The compositions differ sharply. 77 percent of conference presentations report empirical AI work, against 44 percent of journal articles; commentary and review writing accounts for 39 percent of the journal literature but 12 percent of conference presentations.

The contrast is what the two venues' designs produce, not a hidden finding about either. SSWR is an empirical research conference: its submission format asks for background, methods, and results, so a conceptual essay has nowhere natural to sit, and a heavily empirical composition follows. Disciplinary journals publish editorials, ethical analyses, curriculum pieces, and reviews alongside studies, so their mix is broader. The two corpora also do not track the same articles through time: much of the work presented at SSWR is later published in health, informatics, and interdisciplinary journals outside the disciplinary set covered here. Read the comparison descriptively — each panel shows what its venue carries — rather than as evidence that empirical work is missing from anywhere.

One boundary decision matters especially in this venue. SSWR carries a good deal of causal-inference research that runs machine learning as a nuisance estimator (targeted maximum likelihood, double machine learning, gradient-boosted propensity scores) while answering a question unrelated to AI. All three classification runs flagged this boundary independently. The rule applied here: a named algorithm that produces the reported estimates counts as empirical AI work; an unnamed mention of machine learning in a methods list does not. Reasonable analysts could draw that line elsewhere, and a handful of records would move as a block if they did.

Who works with whom

The venue contrast extends to the people doing the work. These are the co-authorship networks of each venue's recurring authors: drag any node to pull the layout apart, and hover over a node to highlight its author in the key.

Node colour places each author on a continuum rather than sorting them into a category: the darkest nodes are authors whose work is wholly empirical, the palest are wholly commentary, and the middle of the ramp is work that studies how the field is responding to AI. The figures in brackets beside each name give that author's empirical / study-of-AI / commentary split, so the colour can be checked against the counts rather than taken on trust.

The two venues have different collaborative shapes. The journal network is one large component plus a few detached teams, a loose core in which the most prolific authors are connected but not tightly clustered. The conference network is more fragmented: several compact teams, each internally dense, with few bridges between them, consistent with research groups presenting their own projects year after year.

Author identity differs by venue. The conference database carries canonical author IDs with name variants resolved across all years, so conference author counts are reliable. The journal database stores names exactly as published with no disambiguation, so journal identity here is surname plus first initial: same-initial namesakes merge, and one person publishing under different name forms may split. Read the journal counts as approximate and the conference counts as solid.

Data and methods

Building the corpus

A wide keyword net was cast over titles and abstracts of the SWRD journal database, restricted to publication_year >= 1989, the systematically compiled window of the database and of its published article. The net spanned era-appropriate vocabulary, from expert system and knowledge-based system through neural network, machine learning and predictive analytics to ChatGPT, large language model and generative AI, with word-boundary anchors on short tokens.

Every match was read; none were sampled. Roughly half of raw matches were false positives in recurring classes: "AI" as American Indian/Alaska Native or Appreciative Inquiry, "deep learning" as pedagogy, "neural network" as brain circuitry, "expert systems" in the sociological sense, and clinical data mining, which in social work denotes manual secondary analysis of case records rather than computation. A semantic recall audit using sentence embeddings then searched by meaning rather than wording, recovering additional in-scope articles that the keyword net missed, most of them from the pre-2000 era, before the modern vocabulary existed.

Finding what the keywords missed: embedding-based search

A keyword net finds only the phrasings its author anticipated, a real limitation across thirty-seven years of changing vocabulary. The databases therefore also store a meaning vector for every abstract, so a query can be matched by sense rather than by string. On this corpus the audit recovered in-scope articles the net had missed, including a 1990 review of automated assessment, a 1989 study of computers and social diagnosis, and a 1993 computerized assessment system, none of which contain the phrase "artificial intelligence" in title or abstract.

The embedding model, precisely

EmbeddingGemma 300M (Google), served locally through Ollama as embeddinggemma:300m, producing 768-dimension vectors. Every abstract in both databases was embedded with this exact model, so query vectors must come from it too; a vector from OpenAI, Cohere, a different Gemma build, or another quantisation is not comparable and returns noise. There is no server-side embedding endpoint; the query vector is generated on your machine (~620 MB, downloaded once).

Required prompt prefix. EmbeddingGemma is trained with task prefixes. Queries must be embedded as task: search result | query: {your question}; documents were embedded as title: … | text: …, already done. Omitting the query prefix is the most common mistake and degrades results badly. Similarity is cosine, 0–1: ≥ 0.55 is usually on topic, ≥ 0.65 strongly so. The search function returns roughly 40 rows per call regardless of the requested count, so deeper coverage comes from unioning several differently-worded statements of the same question.

The model was selected by benchmarking candidates on this corpus: every embedding model tested beat keyword retrieval, open-weight models matched or exceeded commercial APIs, and EmbeddingGemma had the best quality-to-size ratio for a model that runs on a laptop. semantic_audit.py in this folder performs the audit: it checks that Ollama is running with the right model, embeds several statements of the corpus definition, retrieves neighbours, and reports the candidates not already in the corpus. A similarity score only nominates a candidate; a person reads each one and admits it only with a note naming the vocabulary gap that explains the miss.

Assigning the labels

Each article was classified by reading its abstract against the three definitions on this page. To make the labeling checkable rather than asserted, the screening and classification were run four times independently by different AI systems working only from the published documentation, and the label recorded here is the majority judgment. 270 of the 278 articles carried a clear majority; the remaining 8 split evenly and were decided by a human reader. The released data file records every model's individual vote and flags the hand-decided cases, so any reader can see exactly where the classification was contested.

The conference corpus went through the same process: 232 candidate presentations were retrieved and read, 32 were removed as false positives, and three independent runs classified every record without seeing any prior labels. 184 of 232 were unanimous, one record split three ways, and the rest were settled by majority. Agreement between runs was higher on conference abstracts than on journal abstracts (pairwise Cohen's kappa 0.87 to 0.93), likely because conference abstracts are structured, so whether a system was actually run is usually answerable from the methods sentence rather than inferred from prose.

The Web of Science supplement

The database is a versioned release with a fixed end date, and the literature continues past it. To extend coverage, the same keyword net was run in Web of Science over the same journal set for recent years, screened with the same discipline, and deduplicated against the database by DOI. Those records are kept in a separate file and are not merged into the database; the versioned release stays clean, and every count above reports the two sources separately.

What the supplement can and cannot see. Web of Science indexes a curated set of journals. Recent open-access titles, newer journals not yet accepted for indexing, regional and non-English journals, and some practice-facing outlets may be absent from it. The supplement therefore extends the time window but not necessarily the breadth of the original journal set, and articles published in venues outside Web of Science coverage will be missing from the 2025–2026 figures.

Treat the recent years as a lower bound, not a census, as with the 2024–25 database counts, where publisher indexing still lags.

Other limitations

Get the data and the code

Everything behind this page is in the folder it is served from: the labels, the raw candidate set, and the scripts that reproduce the analysis.

Data

Code

The screening and labeling steps are not scripted because they require reading each abstract.

Do the databases need a big model?

No. Querying is plain HTTPS with a public read-only key, so a small model running locally can drive the retrieval pipeline. In building this demonstration, a 35-billion-parameter open-weight model on a laptop connected from the documentation alone, ran the keyword sweeps and SQL, and produced a screened corpus of comparable size to larger models. The differences appeared elsewhere: consistency in applying the three category definitions across hundreds of abstracts, and care with bookkeeping. Whatever model runs the queries, the classification work needs checking.

Related

Social Work Meta-Data Project · University of Michigan School of Social Work · project home · repository

Counts on this page were computed from the released data file and reflect the corpus as of the 2026 database release plus the Web of Science supplement.